This page describes a proprietary endpoint management system that I built while employed as a Linux system administrator and Linux architect.
| Key details | |
|---|---|
| Brief description: | A system to manage operating system patches, deploy internal software, manage security tooling, and manage configuration compliance on thousands of endpoints. |
| Consumer: | Linux system administration team, change management team, internal controls team |
| Impact to consumer: |
|
| Technical features: |
|
| Technologies used: | C, OpenSSL, Bash, Apache HTTP Server, Perl, HTML::Mason (Perl), MariaDB |
The endpoint management system was built after assessing the needs of the
system administration team and evaluating the incumbent mechanisms
(primarily based on SSH keys, update scripts, and multiple
screen sessions), and tools such as Ansible and
Chef. These "industry standard" tools were found to have a much
larger attack surface and maintenance overhead than was warranted by the
features required, and so a custom solution was developed iteratively,
starting with basic patching functionality and working up from there.
Its components are:
- The endpoint agent, written in C, which runs on every endpoint managed by this tool.
- The endpoint management tool, written in HTML::Mason (Perl), providing both a web interface for operators, and the central API for the agents to connect to.
Agents (1) poll the central API over HTTPS at a configurable interval, and will also poll when prompted by the central server via an empty UDP packet on a specific port (with safety constraints built in). This means that the agents are not listening for commands on a port, which reduces their footprint and their attack surface.
The API provides a way for the central server to queue actions and information requests for the agents to act upon. The agents will automatically deliver information such as the list of all installed packages, the package manager's current understanding of which packages are pending update, any AV alerts outstanding, and the results of the most recent configuration compliance check.
Configuration compliance relies on the configuration compliance tool that I built separately to handle configuration policies such as "SSH daemon must reject direct root login". This separation of concerns allowed quicker development, and means that policies can be updated easily without disrupting the agent.
The endpoint management tool (2) provides operators with a dashboard showing the connectivity state, AV alert and threat database status, patching status, compliance status, and outstanding actions.
Information about the endpoints that are expected to be seen (which is how "connectivity" is determined) is derived from other internal databases such as the register of allocated server names, and the site information database which records how many retail back office PCs and tills are in each store. Unknown endpoints are rejected and logged.
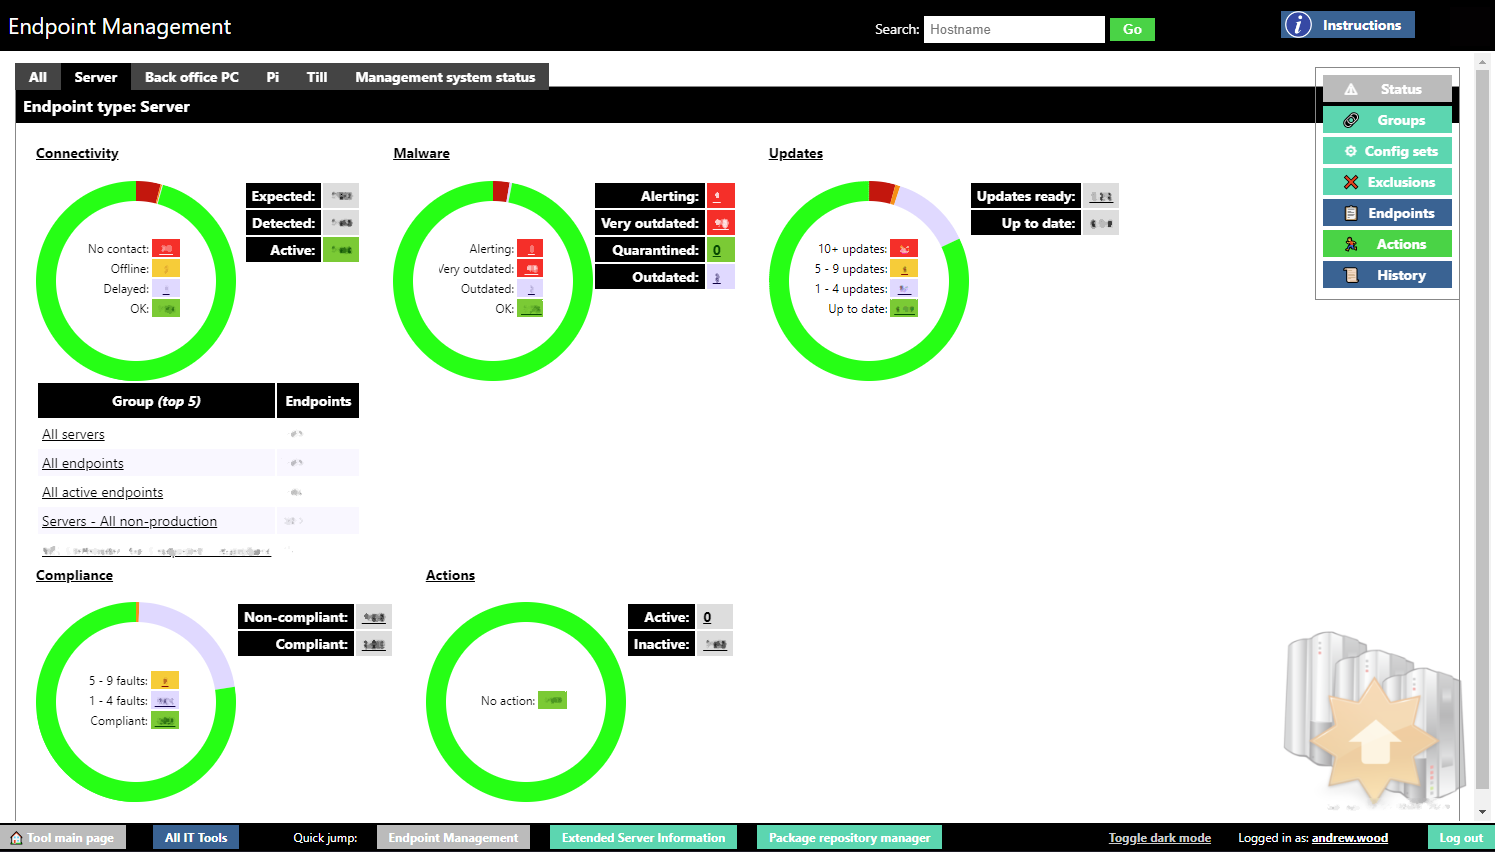
The figure above shows the main dashboard of the endpoint management tool, with sensitive information - mostly endpoint counts - obscured.
Clicking on any of the numbers shown on the main dashboard will list the endpoints involved.
When selecting endpoints, operators can use predefined groups (or define new
ones), apply simple filters, or write Boolean expressions based on endpoint
properties, such as "environment=DEV and osVersion>6 and hasPackage{glibc}".
Operators can perform actions on selected endpoints - such as OS update deployments, custom package deployments (usually via integration with the custom CI/CD system), compliance fixes, service enable/disable, service stop/start, and so on.
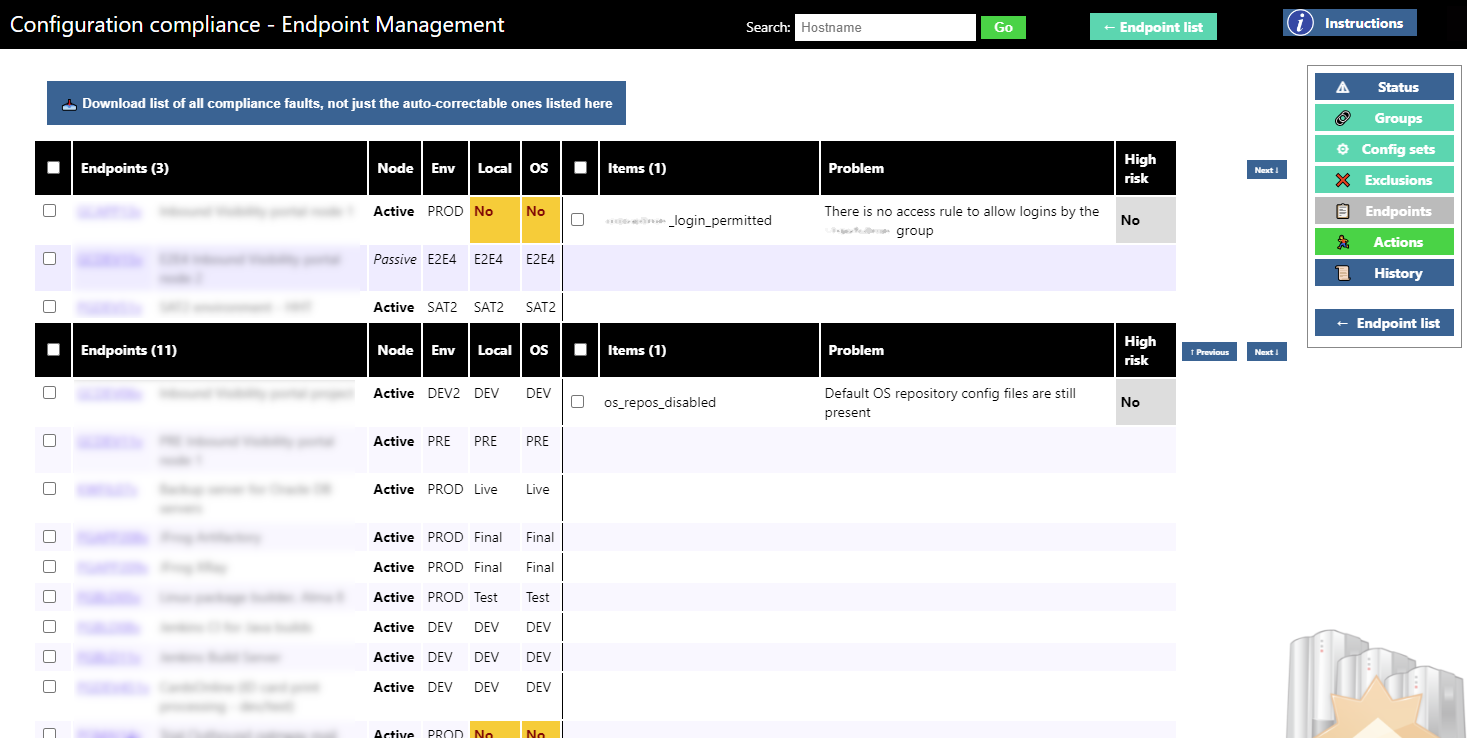
When applying patches / software updates, and when applying compliance fixes, to many endpoints at once, the system groups the endpoints by change set so that the operator can more easily control which specific changes are made where, from a single screen. An example of this is shown in the figure above, again with sensitive information (server name, description, and AD group) obscured.
Key metrics - such as the number of AV alerts currently outstanding for each endpoint type - are written to files for monitoring systems (such as Zabbix) to detect and raise alerts about.
From the action display page, operators can check on the results of actions. When viewing a specific action, operators can view the full output from each endpoint, hide the details of those endpoints that completed the action successfully to highlight errors to be corrected, and download the results for offline analysis.
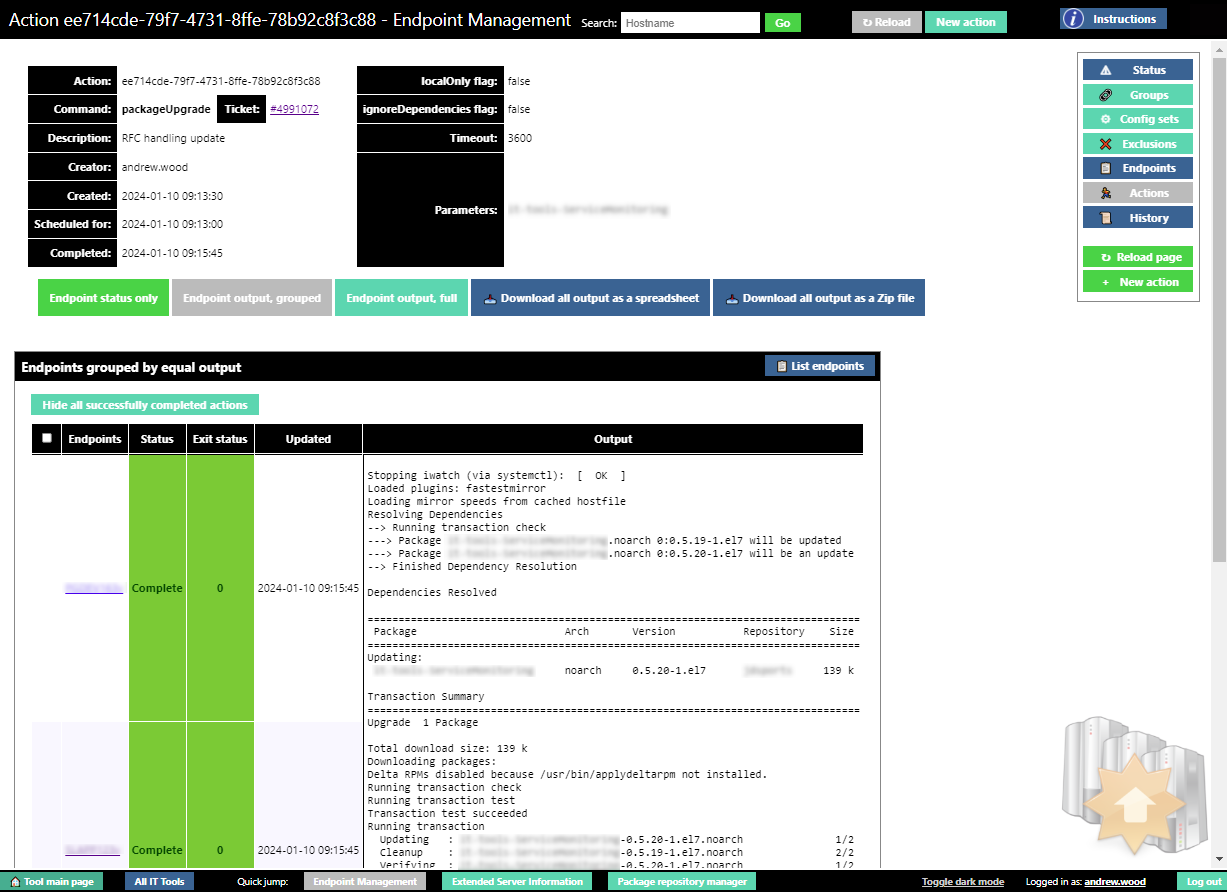
The above figure shows a completed package upgrade action, with the output grouped. The output grouping function brings together each endpoint that had identical output, rather than showing every endpoint's output individually, making it much easier for the operator to review, and clearly highlighting differences in behaviour. The grouping feature is particularly helpful when deploying changes in bulk across hundreds or thousands of endpoints.
All actions are recorded in a history log and the agent also records them to syslog. The application history log is visible to the change auditing tool I provided to the change management and internal controls teams.